Analysis of TOFAS CBT Log Data: The Link Between Calculation Speed and Test Scores
Abstract
This report analyzes data from Calculation Section of TOFAS, a CBT platform provided by SPRIX Inc. By examining the test logs of approximately 100 junior high school students in Japan, we investigated the factors that determine high performance.
1. The “First 5 Minutes” Rule
There is a strong correlation between processing speed in the first 5 minutes and the final test score.
2. Skill Builds Confidence?
While confidence correlates with scores, objective calculation skill is a much stronger predictor. Data suggests that confidence appears to be a secondary outcome largely derived from that skill.
3. Distinctive Test-Taking Patterns
Top students demonstrate efficient time management, creating a time buffer early on. In contrast, lower-performing students often show patterns of “rushing” or “giving up” toward the end.
1. Introduction
With the rapid integration of EdTech and the advancement of the ‘GIGA School’ initiative (Japan’s national program ensuring one digital device per student), Japanese schools are digitizing at an unprecedented pace. Schools are shifting from traditional paper-based assessments to tablets and Computer-Based Testing (CBT). A key advantage of CBT is its ability to record the entire process of answering questions chronologically. This allows us to analyze not just the final score, but how a student solves problems — including their response speed and time allocation.
This report uses CBT log data from TOFAS combined with survey data on “Confidence in Calculation” to answer three key questions:
- Does answering speed and accuracy on basic problems predict the overall test score?
- Which is more important for success: Objective skill (speed/accuracy) or subjective confidence?
- How do answering patterns differ between high-scoring and low-scoring students?
2. Methodology
To ensure data accuracy, this study focused on a single junior high school to control for educational environment.
| Survey Period | July 2025 (After the first-semester final exams). |
| Participants | Approximately 100 second-year students at a public junior high school in Japan. |
| Test Tool | TOFAS (Test of Fundamental Academic Skills) - Calculation Section by SPRIX Inc. |
| Test Structure | 60 questions in 40 minutes. Q1–20: Basic review of 1st-year material [e.g., (5x-9)-(-x-4)]. / Q21–40: Polynomials [e.g., 6ab^2×6a^2b^3] / Q41–60: Simultaneous Equations [e.g., -0.8x+0.3y=0.4 & 0.4x-0.6y=-5.6]. |
When citing this report, please attribute it to the “SPRIX Education Foundation.” The survey was administered by SPRIX Inc. on our behalf, and the analysis was conducted by the Foundation using anonymized data. In addition, we have withheld the exact number of respondents to ensure anonymity.
3. Results
3.1. The “First 5 Minutes” Rule
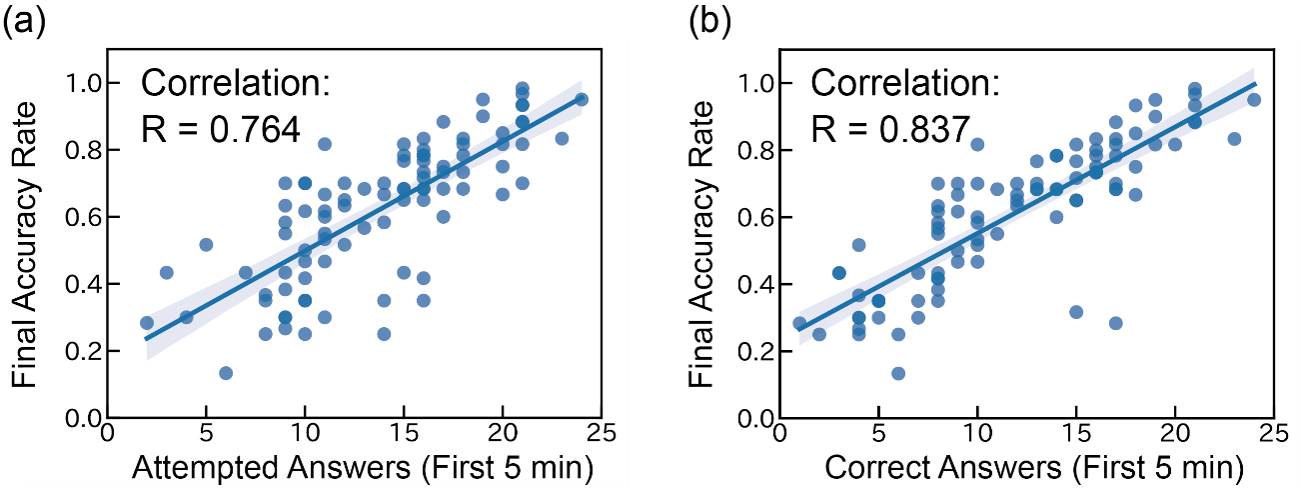
We investigated the relationship between the speed of solving basic problems at the start of the test and the final result. Figure 1(a) shows the relationship between the number of attempted answers in the first 5 minutes and the final score (Correlation R = 0.764). Figure 1(b) shows the relationship between the number of correct answers in the first 5 minutes and the final score (Correlation R = 0.837).
As shown in Figure 1(a) and (b), there is a significant positive correlation between performance in the first five minutes and the overall test result. Specifically, Figure 1(b) demonstrates that the number of correct answers during this initial phase is a strong predictor of final success (R = 0.837). This indicates that the ability to process basic problems quickly is the foundation for high scores.
3.2. Skill Builds Confidence?
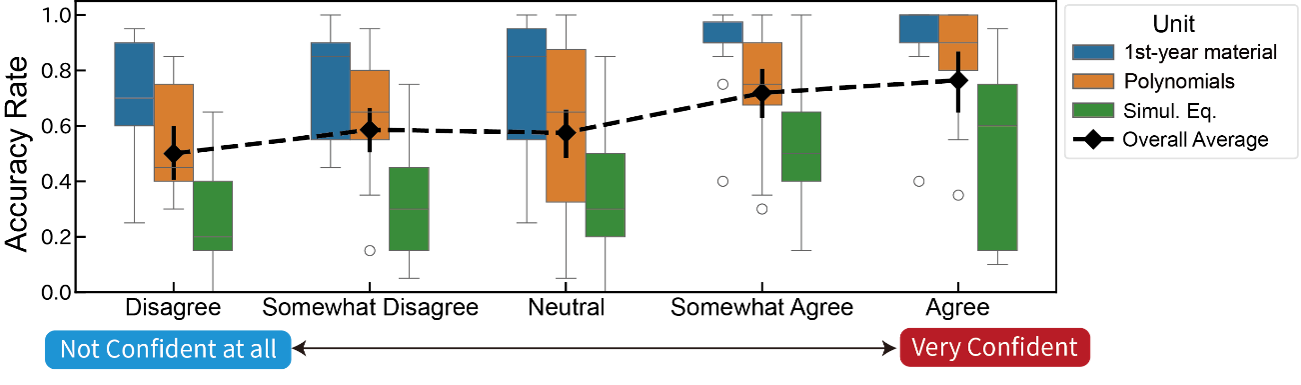
It is often said that confidence leads to better scores. We compared subjective confidence with objective speeds to see which correlates more strongly with the final accuracy rate. Figure 2 illustrates the link between subjective confidence and actual test performance. While students who expressed higher confidence tended to score better, the correlation (R = 0.384) is notably weaker than the correlation with objective speed shown in Figure 1.
A detailed unit-by-unit analysis confirms this trend:
Part 1 (Basic Review of 1st-year material): R = 0.318
Part 2 (Polynomials): R = 0.326
Part 3 (Simultaneous Equations): R = 0.368
As shown, the correlation with confidence remains moderate across all sections and does not reach the strength of the correlation seen with initial processing speed (R = 0.837). These results suggest that confidence is likely a secondary factor derived from objective skill; students feel confident because they have the ability to solve problems quickly and accurately.
3.3. Distinctive Test-Taking Patterns
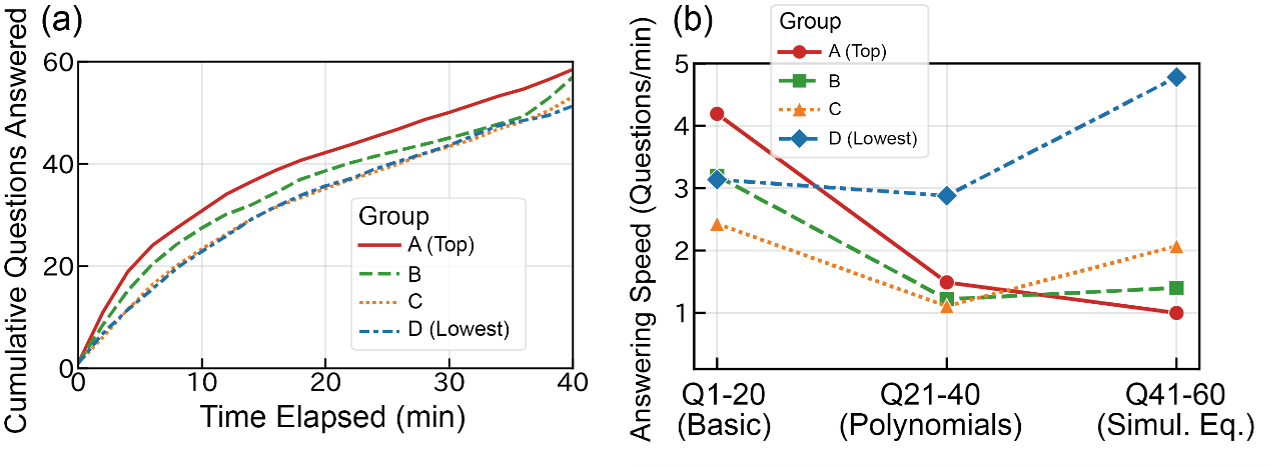
We divided students into four equal groups based on their final scores (Group A = Highest, to Group D = Lowest) to analyze their test-taking patterns. Figure 3(a) and (b) reveal distinct behavioral differences between high and low performers.
The progress curves in Figure 3(a) show that Group A (Top) establishes a steep trajectory
from the start, maintaining a clear lead throughout the session. In contrast, lower-performing groups show flatter curves, indicating a consistently slower pace required to process the problems. As time progresses, the gap between Group A and these lower groups widens drastically, proving that the difference in total score is largely determined by the pace established in the first half of the test
Figure 3(b) reveals how students adjusted their speed as the test difficulty increased.
Group A (Ideal Time Management): This group is the only group that successfully slowed down in the final section (from 1.5 to 1.0 questions/min). They used the time buffer created early on to tackle complex problems with care.
Groups B & C (Under Time Pressure): Unlike Group A, these groups increased their speed in the final section, indicating they were running out of time. Group B accelerated slightly (1.2 → 1.4 questions/min), suggesting a race against the clock. Group C, however, nearly doubled their speed (1.1 → 2.1 questions/min) in a rush at the expense of accuracy.
Group D (Giving Up): This group displayed a distinct anomaly. Their answering speed spiked to an implausible rate (approx. 12 seconds per problem). Given that this section involves simultaneous equations requiring multiple calculation steps, this pace suggests they stopped engaging with the content and resorted to random guessing to finish.
4. Discussion and Tips for Educators
4.1. Mastery Leads to Automaticity
Our report shows that foundational speed strongly predicts the outcome. Therefore, it is important for students to master basic calculations until they become automatic. When students can solve basic facts instinctively, they gain the mental bandwidth and time required to focus on complex tasks, such as reading word problems or setting up equations.
4.2. Create Confidence Through Small Wins
Since objective skills build confidence (and not necessarily the other way around), teachers may focus on skill acquisition first. By ensuring students master a specific, narrow range of problems, they can achieve “small wins”. These concrete results build genuine confidence, creating a positive cycle: Success → Confidence → Motivation.
4.3. Using Data to Spot “Giving Up”
The “giving up” pattern observed in Group D is a critical signal for educators. CBT data allows teachers to distinguish whether a student failed because they truly lacked knowledge, or because they gave up. Identifying the root cause (knowledge gap, time management, or psychological factors) enables more personalized and effective guidance, moving beyond standardized instruction.
Contact Information
SPRIX Education Foundation Survey Desk: Hata / Mimura
Address: Shibuya Sakura Stage SHIBUYA Tower 22F, 1-1 Sakuragaoka-cho, Shibuya-ku, Tokyo 150-6222
URL: https://sprix-foundation.org/en
Information about TOFAS
TOFAS (Test of Fundamental Academic Skills) is a global assessment platform for fundamental academic skills, developed and provided by SPRIX Inc. For more information, please visit the official website: https://tofas.education/